ISO/IEC 10918-1 : 1993(E)
00
01
10
11
70
71
77
17
07
00
S
S
S
S
S
S
S
S
S
01
10
11
70
71
77
17
07
00
01
10
11
70
71
77
17
07
FDCT
s
s
s
s
s
s
s
s
s
Sq
Sq
Sq
Sq
Sq
Sq
Sq
Sq
Sq
00
01
10
11
70
71
77
17
07
Q
Q
Q
Q
Q
Q
Q
Q
Q
00
01
10
11
70
71
77
17
07
00
01
10
11
70
71
77
17
07
00
01
10
11
70
71
77
17
07
Sq
Sq
Sq
Sq
Sq
Sq
Sq
Sq
Sq
r
r
r
r
r
r
r
r
r
R
R
R
R
R
R
R
R
R
IDCT
TISO0820-93/d018
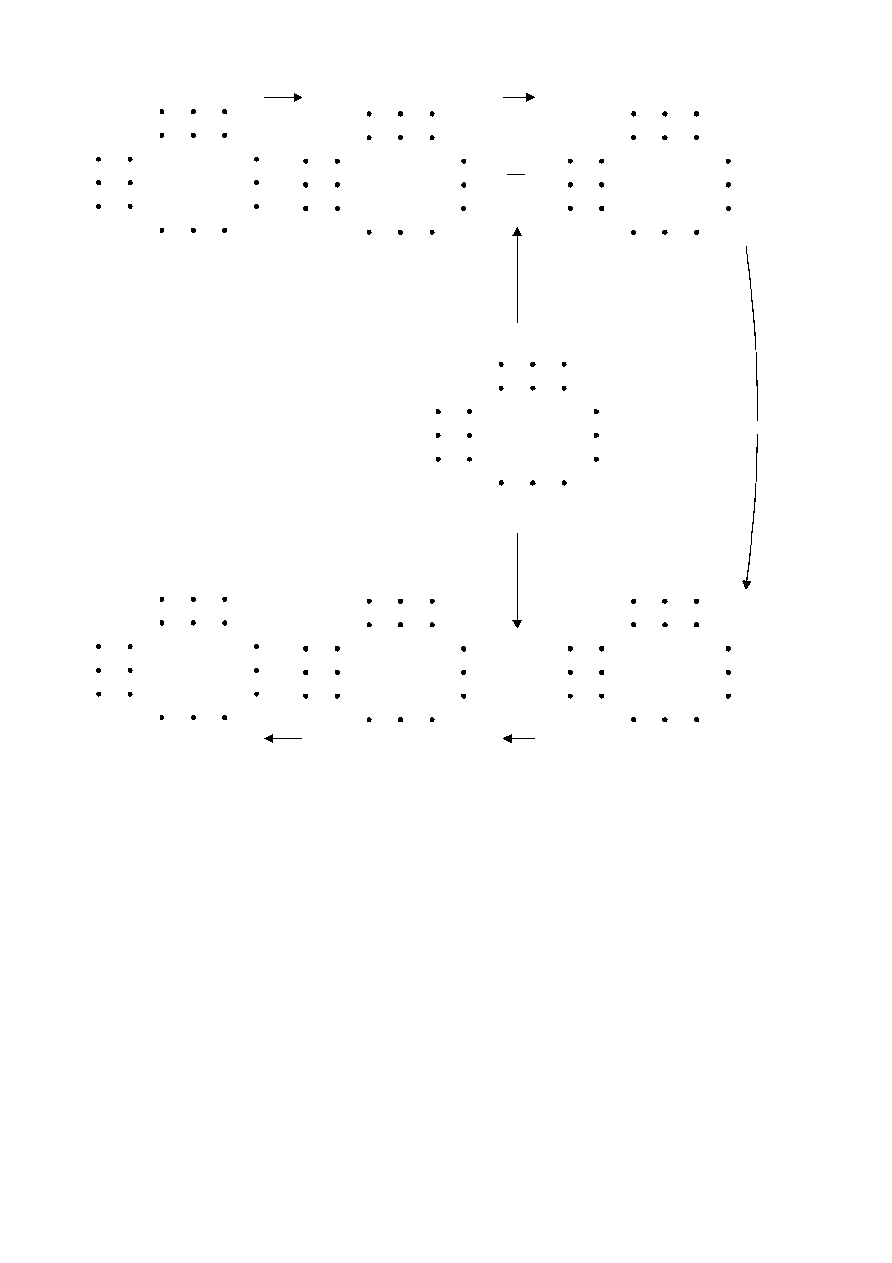
Quantize
Quantization table
Transmission
Left
Right
Top
Bottom
Left
Right
Top
Bottom
Source image samples
(after level shift)
DCT coefficients
Quantized DCT coefficients
Dequantize
Reconstructed image samples
(before level shift)
Dequantized DCT coefficients
Received quantized DCT coefficients
R = Sq × Q
vu
vu
vu
Svu
Qvu
vu
round
= Sq
( )
Figure A.5 Relationship between 8 × 8-block samples and DCT coefficients
FIGURE A.5 [D18] 21 cm = 821 %
CCITT Rec. T.81 (1992 E)
29