background image
ISO/IEC 10918-1 : 1993(E)
4.3
DCT-based coding
Figure 4 shows the main procedures for all encoding processes based on the DCT. It illustrates the special case of a single-
component image; this is an appropriate simplification for overview purposes, because all processes specified in this
Specification operate on each image component independently.
TISO0680-93/d004
DCT-based encoder
8 × 8 blocks
FDCT
Quantizer
Entropy
encoder
Table
specifications
Table
specifications
Source
image data
Compressed
image data
Figure 4 ­ DCT-based encoder simplified diagram
FIGURE 4 [D04] 7 cm = 273 %
In the encoding process the input component's samples are grouped into 8
×
8 blocks, and each block is transformed by
the forward DCT (FDCT) into a set of 64 values referred to as DCT coefficients. One of these values is referred to as the
DC coefficient and the other 63 as the AC coefficients.
Each of the 64 coefficients is then quantized using one of 64 corresponding values from a quantization table (determined
by one of the table specifications shown in Figure 4). No default values for quantization tables are specified in this
Specification; applications may specify values which customize picture quality for their particular image characteristics,
display devices, and viewing conditions.
After quantization, the DC coefficient and the 63 AC coefficients are prepared for entropy encoding, as shown in Figure
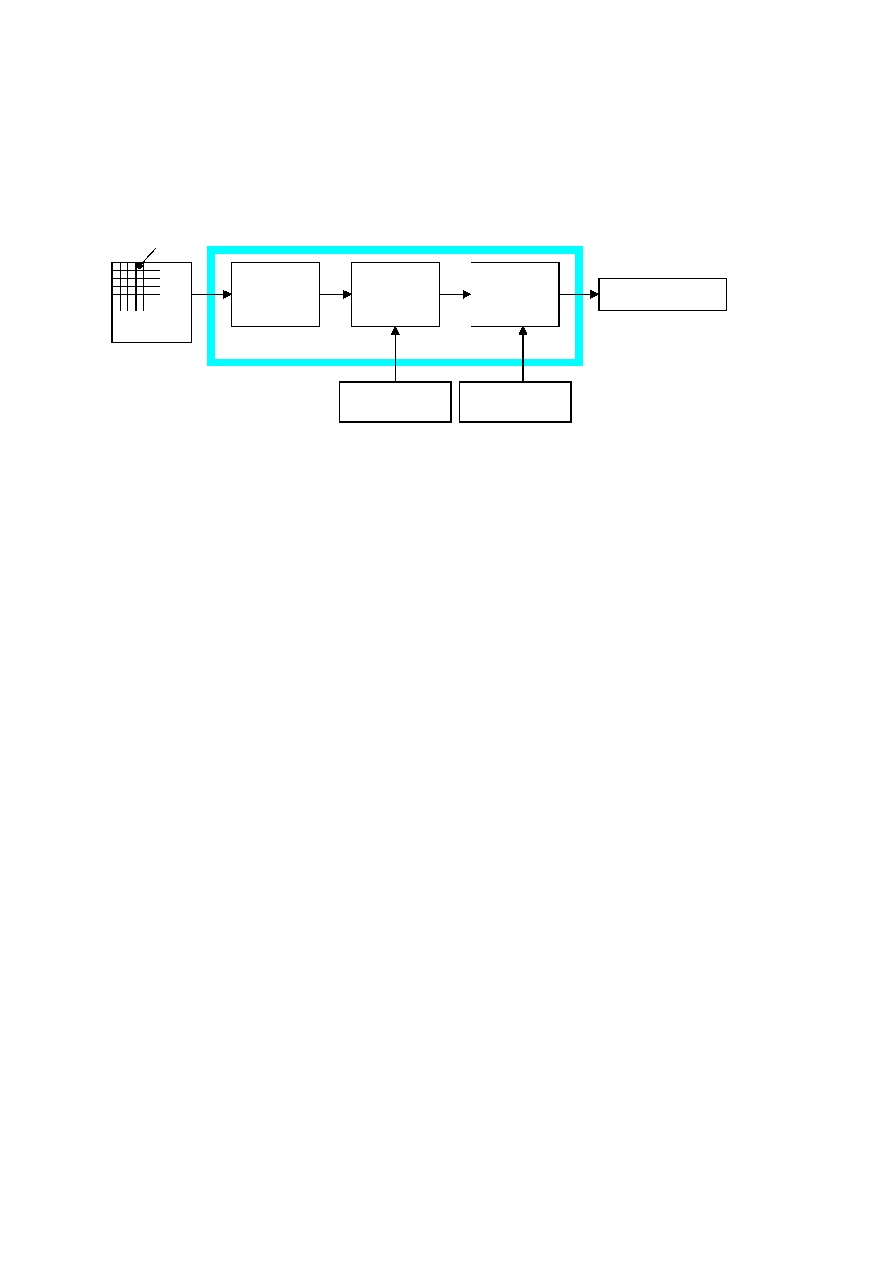
5. The previous quantized DC coefficient is used to predict the current quantized DC coefficient, and the difference is
encoded. The 63 quantized AC coefficients undergo no such differential encoding, but are converted into a one-
dimensional zig-zag sequence, as shown in Figure 5.
The quantized coefficients are then passed to an entropy encoding procedure which compresses the data further. One of
two entropy coding procedures can be used, as described in 4.6. If Huffman encoding is used, Huffman table
specifications must be provided to the encoder. If arithmetic encoding is used, arithmetic coding conditioning table
specifications may be provided, otherwise the default conditioning table specifications shall be used.
Figure 6 shows the main procedures for all DCT-based decoding processes. Each step shown performs essentially the
inverse of its corresponding main procedure within the encoder. The entropy decoder decodes the zig-zag sequence of
quantized DCT coefficients. After dequantization the DCT coefficients are transformed to an 8
×
8 block of samples by
the inverse DCT (IDCT).
4.4
Lossless coding
Figure 7 shows the main procedures for the lossless encoding processes. A predictor combines the reconstructed values of
up to three neighbourhood samples at positions a, b, and c to form a prediction of the sample at position x as shown in
Figure 8. This prediction is then subtracted from the actual value of the sample at position x, and the difference is
losslessly entropy-coded by either Huffman or arithmetic coding.
CCITT Rec. T.81 (1992 E)
15
[1] [2] [3] [4] [5] [6] [7] [8] [9] [10] [11] [12] [13] [14] [15] [16] [17] [18] [19] [20] [21] [22] [23] [24] [25] [26] [27] [28] [29] [30] [31] [32] [33] [34] [35] [36] [37] [38] [39] [40] [41] [42] [43] [44] [45] [46] [47] [48] [49] [50] [51] [52] [53] [54] [55] [56] [57] [58] [59] [60] [61] [62] [63] [64] [65] [66] [67] [68] [69] [70] [71] [72] [73] [74] [75] [76] [77] [78] [79] [80] [81] [82] [83] [84] [85] [86] [87] [88] [89] [90] [91] [92] [93] [94] [95] [96] [97] [98] [99] [100] [101] [102] [103] [104] [105] [106] [107] [108] [109] [110] [111] [112] [113] [114] [115] [116] [117] [118] [119] [120] [121] [122] [123] [124] [125] [126] [127] [128] [129] [130] [131] [132] [133] [134] [135] [136] [137] [138] [139] [140] [141] [142] [143] [144] [145] [146] [147] [148] [149] [150] [151] [152] [153] [154] [155] [156] [157] [158] [159] [160] [161] [162] [163] [164] [165] [166] [167] [168] [169] [170] [171] [172] [173] [174] [175] [176] [177] [178] [179] [180] [181] [182] [183] [184] [185] [186]